This post is the next part of my previous article called Over The Flow (Part 1). In this post I will reproduce the server crush and try to identify how to position the shellcode meaning identify the EIP register position using Olly Debugger v1.0. In the previous post I found out the server crushed when I inserted 126 end brackets (meaning this character }, translating to 7D in Hexadecimal) in the command LIST. So lets not lose any time. But before I do that I will explain some preliminaries first about the stack and the CPU registers.
A little about the assembly
x86 assembly language is a family of backward-compatible assembly languages, which provides some level of compatibility all the way back to the Intel 8008. x86. Assembly languages are used to produce object code for the x86 class of processors, which includes Intel's Core series and AMD's Phenom and Phenom II series. Like all assembly languages, it uses short mnemonics to represent the fundamental operations that the CPU in a computer can perform.
A little about the stack as a generic structure
In computer science, a stack is a last in, first out (LIFO) abstract data type and linear data structure. A stack can have any abstract data type as an element, but is characterized by two fundamental operations, called push and pop. The push operation adds a new item to the top of the stack, or initializes the stack if it is empty. If the stack is full and does not contain enough space to accept the given item, the stack is then considered to be in an overflow state. The pop operation removes an item from the top of the stack. A pop either reveals previously concealed items, or results in an empty stack, but if the stack is empty then it goes into underflow state (It means no items are present in stack to be removed).

A stack is a restricted data structure, because only a small number of operations are performed on it. The nature of the pop and push operations also means that stack elements have a natural order. Elements are removed from the stack in the reverse order to the order of their addition: therefore, the lower elements are those that have been on the stack the longest.
A little about the stack in Windows NT family
In Windows NT operating system family threads is a kernel build in feature, meaning that Windows cannot fork processes unlike Linux operating systems. That is why it is very common for a process to spawn threads to handle the assigned tasks. In Windows NT series a stack is allocated per thread and each thread will get by default a 4K stack allocated.

Note: As you can see threads share the same program code, data and files.
We should also note at this point that Windows executables are structured as defined in the PE-COFF standard.The Common Object File Format (COFF) is a specification of a format for executable, object code, and shared library computer files used on Unix systems. It was introduced in Unix System V, replaced the previously used a.out format, and formed the basis for extended specifications such as XCOFF and ECOFF, before being largely replaced by ELF, introduced with SVR4. COFF and its variants continue to be used on some Unix-like systems and on Microsoft Windows.
When a COFF file is generated, it is not usually known where in memory it will be loaded. The virtual address where the first byte of the file will be loaded is called image base address. The rest of the file is not necessarily loaded in a contiguous block, but in different sections. Relative Virtual Addresses (RVAs) are not to be confused with standard virtual addresses. A relative virtual address is the virtual address of an object from the file once it is loaded into memory, minus the base address of the file image. If the file were to be mapped literally from disk to memory, the RVA would be the same as that of the offset into the file, but this is actually quite unusual.

Note: that the RVA term is only used with objects in the image file. Once loaded into memory, the image base address is added, and ordinary VAs are used. So when we load our executable to the debugger we see a contiguous space of addresses allocated.
A little about CPU registers
In computer architecture, a processor register is a small amount of storage available as part of a CPU or other digital processor. Such registers are (typically) addressed by mechanisms other than main memory and can be accessed more quickly. Almost all computers, load-store architecture or not, load data from a larger memory into registers where it is used for arithmetic, manipulated, or tested, by some machine instruction. Manipulated data is then often stored back in main memory, either by the same instruction or a subsequent one. Modern processors use either static or dynamic RAM as main memory, the latter often being implicitly accessed via one or more cache levels. A common property of computer programs is locality of reference: the same values are often accessed repeatedly and frequently used values held in registers improves performance. This is what makes fast registers (and caches) meaningful.
Processor registers are normally at the top of the memory hierarchy, and provide the fastest way to access data. The term normally refers only to the group of registers that are directly encoded as part of an instruction, as defined by the instruction set. However, modern high performance CPUs often have duplicates of these "architectural registers" in order to improve performance via register renaming, allowing parallel and speculative execution. Modern x86 is perhaps the most well known example of this technique.
A little about general-Purpose CPU Registers
A register is a small amount of storage on the CPU and is the fastest method for a CPU to access data. In the x86 instruction set, a CPU uses eight general purpose registers: EAX, EDX, ECX, ESI, EDI, EBP, ESP, and EBX. More registers are available to the CPU. Each of the eight general-purpose registers is designed for a specific use, and each performs a function that enables the CPU to efficiently process instructions.
The EAX register, also called the accumulator register, is used for performing calculations as well as storing return values from function calls. Many optimized instructions in the x86 instruction set are designed to move data into and out of the EAX register and perform calculations on that data. Most basic operations like add, subtract, and compare are optimized to use the EAX register.
As previously noted, return values from function calls are stored in EAX. In addition, you can determine the actual value of what the function is returning. The EDX register is the data register. This register is basically an extension of the EAX register, and it assists in storing extra data for more complex calculations like multiplication and division. It can also be used for general purpose storage,but it is most commonly used in conjunction with calculations performed with the EAX register.
The ECX register, also called the count register, is used for looping operations. The repeated operations could be storing a string or counting numbers. An important point to understand is that ECX counts downward, not upward.
In x86 assembly, loops that process data rely on the ESI and EDI registers for efficient data manipulation. The ESI register is the source index for the data operation and holds the location of the input data stream. The EDI register points to the location where the result of a data operation is stored, or the destination index. An easy way to remember this is that ESI is used for reading and EDI is used for writing.
Using the source and destination index registers for data operation greatly improves the performance of the running program. The ESP and EBP registers are the stack pointer and the base pointer,respectively. These registers are used for managing function calls and stack operations.
When a function is called, the arguments to the function are pushed onto the stack and are followed by the return address. The ESP register points to the very top of the stack, and so it will point to the return address. The EBP register is used to point to the bottom of the call stack. In some circumstances a compiler may use optimizations to remove the EBP register as a stack frame pointer; in these cases the EBP register is freed up to be used like any other general-purpose register.
The EBX register is the only register that was not designed for anything specific. It can be used for extra storage. One extra register that should be mentioned is the EIP register. This register points to the current instruction that is being executed. As the CPU moves through the binary executing code, EIP is updated to reflect the location where the execution is occurring. A debugger must be able to easily read and modify the contents of these registers. Each operating system provides an interface for the debugger to interact with the CPU and retrieve or modify these values.

Note: This is the CPU register collection.
Below you can see the conceptual representation of the stack:

Note: This is how a loaded function looks when loaded in CPU.
Now when we attach the debugger to the IMAP4.exe executable we would see all registers occupied by the desired process. And by saying that I mean the Floating Point Unit (FPU, colloquially a math co-processor) of IMAP4 process. The following image shows an overview of the registers and stack of the assembly language:

Note: See the general purpose registers, along with the stack and base pointer.The stack is a very important structure to understand when developing a debugger. The stack stores information about how a function is called, the parameters it takes, and how it should return after it is finished executing. The stack is a First In, Last Out (FILO) structure, where arguments are pushed onto the stack for a function call and popped off the stack when the function is finished.
A little about debuggers
A debugger or debugging tool, a computer program that is used to test and debug other programs (the "target" program). The code to be examined might alternatively be running on an instruction set simulator (ISS), a technique that allows great power in its ability to halt when specific conditions are encountered but which will typically be somewhat slower than executing the code directly on the appropriate (or the same) processor.
A "crash" happens when the program cannot normally continue because of a programming bug. For example, the program might have tried to use an instruction not available on the current version of the CPU or attempted to access unavailable or protected memory. When the program "crashes" or reaches a preset condition, the debugger typically shows the location in the original code if it is a source-level debugger or symbolic debugger, commonly now seen in integrated development environments. If it is a low-level debugger or a machine-language debugger it shows the line in the disassembly (unless it also has online access to the original source code and can display the appropriate section of code from the assembly or compilation).
Attaching the IMAP4 process to our debugger
We will now attach our vulnerable program to Olly Debugger v1.0. There are subtle differences between opening a process and attaching to a process. The advantage of opening a process is that you have control of the process before it has a chance to run any code. This can be handy when analyzing Mal-ware or other types of malicious code. So the string that crashed the server had this format a001 LIST [ }*126 ] CRLF. Now I am going to run Olly Debugger v1.10 and attach the IMAP4 server to our debugger. We do File -> Attach and we get this picture:

Note: See that the debugger opens up a task like windows and show all running processes. We click the IMAP4.exe running to attach it.

Note: This is the part of the window that show the application registers (I know it is getting darker and darker). Take a look at the EIP register.Have a look at the FPU of our process you can see that the first register is EBX, second comes ECX, third EDX, forth ESI and last EDI. While EIP has a totally different address.
A little about the EIP register
The instruction pointer is called IP in 16-bit mode, EIP in 32-bit mode,, and RIP in 64-bit mode.The instruction pointer register points to the memory address which the processor will next attempt to execute the next program command.
What does EIP register contain and how to access it:
- The EIP register always contains the address of the next instruction to be executed.
- You cannot directly access or change the instruction pointer.
- However, instructions that control program flow, such as calls, jumps, loops, and interrupts, automatically change the instruction pointer.
In order to map the position of the EIP register we would use two tools from the metasploit the patten_create.rb and the pattern_offset.rb. In order to use this tools you would have to go to C:\metasploit\msf3\tools (this path is for the metasploit installed in windows). then type patten_create.rb 1000 (we know that). The following screen shot shows how to use the tool:

The following window shows how the pattern_offset.rb works:

Note: This screen shots do not use the metasploit version (I made some modifications for my convenience).
So now I will use the pattern to locate the exact position of the EIP register, the following simple python script will do the job:

Note: See that the ESI register was overwritten, but what about the EIP address? (check out that the application paused but not terminated). The EIP address was not overwritten before the Shift+F9 which means that the operating system (OS) handled the buffer overflow. Well this happened because the OS through an exception using the Structured Exception Handling mechanism.
About Structured Exception Handling (SEH)
Microsoft supports SEH as a programming technique at compiler level only (It means that when you write the code you do not have to take into consideration exception handling, the compiler does everything for you, simplistically speaking of course!!!) this type of programs are called SafeSEH programs. More specifically SafeSEH is a security feature that protects the Structured Exception Handler from being corrupted or hijacked in the event of a buffer overflow. MS Visual C++ compiler features 3 non-standard keywords: __try, __except and __finally are for this purpose. Other exception handling aspects are backed up by a number of Win32 API functions, e.g. RaiseException to raise SEH exceptions manually.
An exception is an event that occurs during the execution of a program, and requires the execution of code outside the normal flow of control. There are two kinds of exceptions: hardware exceptions and software exceptions:
- Hardware exceptions are initiated by the CPU. They can result from the execution of certain instruction sequences, such as division by zero or an attempt to access an invalid memory address.
- Software exceptions are initiated explicitly by applications or the operating system. For example, the system can detect when an invalid parameter value is specified.
More specifically imagine when a thread faults, the operating system using SEH gives you an opportunity to be informed about the fault. When a thread faults, the operating system calls a user-defined callback function. This callback function can do pretty much whatever it wants. For instance, it might fix whatever caused the fault, or it might help you exploit the vulnerable program. Regardless of what the callback function does, its last act is to return a value that tells the system what to do next. (again simplistically speaking).
Theoretically someone can mitigate these risks by:
- Enabling Structured Exception Handling Overwrite Protection (SEHOP)
- Recompiling software using a newer version of Microsoft Visual C++
Locating the SEH handler to exploit IMAP4.exe
From the Hackers perspective it is not needed all the information mentioned above, the only thing the hacker needs to know is a way to overwrite the default SEH handler, which translates to knowing how the SEH is structured in the stack and finding the end of the SEH chain, were the default handler is located.
The exception handlers are all linked to each other and they form a linked list chain on the stack, that is palced relatively close to the bottom of the stack. When an exception occurs, Windows retrieves the head of the SEH chain walks through the list and tries to find the suitable handler to close the application properly.
So again simplisticly speaking SEH is a per-thread structure in memory that provides a linked list of error handler addresses that can be used by Windows programs to gracefully deal with exceptions, like the one we generated in the previous post when we fuzzed the application.
The screen shot below show the end of the SEH chain for our program:

Note: This is a Olly Debugger v1.0 screen shot before any injection is made. See the default SE Handler seats below the End of SEH chain and is 01CCFFE. Also see the address of the Next record address which is FFFFFFF indicating that this is the end of the SEH.
If you go the debugger (meaning Olly Debugger v1.0) attach the executable IMAP4 you can see the SEH chain by doing a View -> SEH Chain. Well if you do that you will see that in the SEH windows there only one entry.

Note: This is the IMAP4.exe SEH Chain entry table.What you should see now is an intact SEH chain – one that hasn’t been overwritten. You can tell this because the handler address is a valid one within kernel32dll (from the SEH chain window – see screenshot above) and because the SEH entry near the bottom of the stack is preceded by an entry with the data FFFFFFFF (this stack entry should be marked as “Pointer to next SEH record” shown in previous screen shots).
When we performs a regular stack based buffer overflow, we overwrite the return address of the Extended Instruction Pointer (EIP) and when doing a SEH overflow, we continue overwriting the stack after overwriting EIP, so we can overwrite the default exception handler located at the end of the SEH chain, in our exploit there is only one entry in the SEH chain so there is only one default SE Handler at the bottom of our stack.
So again when the exception is triggered the program flow go to the default SE Handler (for the reasons described above). All we need now is to insert some code to redirect the execution to our payload. As the Next SEH pointer is before the SE handler we can overwrite the Next SEH (which again in our case is the end of the SEH).Since the shellcode is located after the Handler. We must trick the SE Handler to execute a POP POP RET instruction to set the address in such a way so the Next SEH will be placed in the EIP, there for executing the code in Next SEH.
Now as already mentioned what we need to do is to overwrite the exception handler of the vulnerable application and make the program return to our shellcode using the next SE Handler , which by the time that happens our shellcode will be already loaded to our stack (meaning one of the stack registers e.g. ESP/ECX e.t.c). In order to do that we would have to use the metasploit tools pattern_create.rb and pattern_offset.rb. So again with the use of a simple Python script I am injecting the string generated from the pattern_create.rb (remember that in the previous part we identified that the buffer had length 126 characters, with an ending character of }represented as 7D in Hexadecimal).
This is our simple Python program that is going to do the dirty job:

Note: As you can see I modified the beginning of the the unique pattern so as to overwrite the SEH pointer with 4 A's and the handler with 4 C's. I used the information of the pattern_offset.rb to calculate the SEH distance which by the way was 2 ( again I made sure I kept the size of the string to 126 characters, ending with a single }).
So the vulnerable IMAP4.exe that loaded to Olly Debugger v1.0 looks like this (this is the memory dump):

The following screen shot from Olly Debugger v1.0 shows the View -> SEH Chain, before the Shit+F9 pressing of the button:

Note: You can also see the thread hexadecimal.
The program after the string injection pauses, meaning that the SEH trough's a software interrupt which gets captured by Olly Debugger v1.0 and pauses the program execution. Now if I press Shift+F9 the code executes lets say normally. If you look at the EIP register you will see that it was overwritten with the handlers 4 C's.

Note: As expected the handler was passed to the EIP.
If we press the play button we get this window:

Note: Again a none readable address for EIP.
It is also important to note that OllyDbg v1.0 features a plug-in architecture that allows third parties to add functionality to the debugger by providing the necessary code in a dll file which can be placed in the OllyDbg v1.0 directory.There are a number of OllyDbg plug-ins available for download from the OpenRCE site at the following URL: http://www.openrce.org/downloads/browse/OllyDbg_Plugins
In this section, I will briefly cover the use of one plug-in that is particularly useful when writing SEH exploits – OllySSEH.This plug-in is available from the following link and allows you to easily see which modules loaded with an application can be used to provide overwrite addresses when writing an SEH exploit.
To install the plug-in, simply take the OllySSEH.dll file from the \ollysseh\Project\Release\ directory in the zip file, and copy it to the OllyDbg main program directory. Then restart OllyDbg v1.0.
The following screen shot shows the SSEH for our vulnerable application:
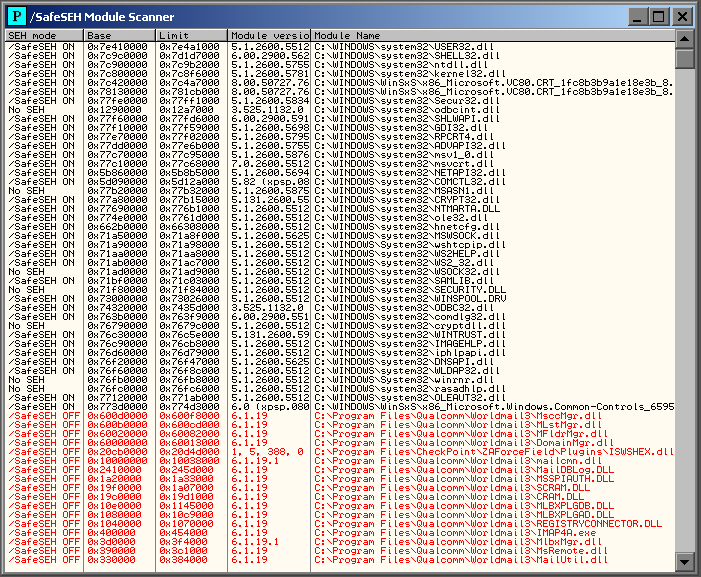
Note: See that all module from the application did not use the SSEH technology, the SSEH flag is set to OFF.
The SEH Handler and the POP POP RET
One of the simplest ways in which to perform software exploitation is to use instructions located in specific areas of memory to redirect code execution to areas of memory that we can control. In the case of the vulnerability described so far in this tutorial we have managed to set the EIP register to locations of our choosing both via directly overwriting a RETN address on the stack and by using an overwritten SEH entry to redirect execution via the windows error handling routines. If we want to use this control over EIP to redirect to our own code inserted within the application, the simplest way to proceed is to find instructions that can perform this redirection at known locations within memory.
The best place to look for these instructions is within the main executables code or within the code of an executable module that is reliably loaded with the main executable. We can see which modules we have to choose from by allowing the program to run normally and then checking the list of executable modules in OllyDbg v1.0.
The steps we have to follow to exploit the application are:
- When the exception is triggered the program flow go to the SE Handler.
- All we need is just put some code to jump to our payload.
- Faking a second exception makes the application goes to the next SEH pointer (not needed for our example).
- As the Next SEH pointer is before the SE handler we can overwrite the Next SEH.
- Since the shellcode sits after the Handler, we can trick the SE Handler to execute POP POP RET. instructions so the address to the Next SEH will be placed in EIP, therefore executing the code in Next SEH.
Let’s try searching for all instances of POP, POP, RET sequences in USER32.dll. Make sure that module is still selected in the CPU View, then right click on the top left hand pane and select Search for->All sequences. Then, in the find sequence of commands window that appears type the following:
POP r32
POP r32
RETN
The Olly Debugger v1.0 utility screen shot looks like this:

Note: Where “r32″ is shorthand for any 32 bit register (e.g. ESP, EAX, etc).
Epilogue
In this article we managed to overwrite the SEH Next record pointer register and the SE Handler register with desired sequence of characters the 4 B's and 4 C's. In part 3 we will talk about shellcodes and in part 4 we will do the shellcode injection.
To be continued...
Reference:
- http://en.wikipedia.org/wiki/X86_assembly_language
- http://www.c-jump.com/CIS77/ASM/Instructions/I77_0190_lea_instruction.htm
- http://en.wikipedia.org/wiki/X86_assembly_language
- http://resources.infosecinstitute.com/debugging-fundamentals-for-exploit-development/#starting
- Gray Hat Python (Python Programming for Hackers and Reverse Engineers) by Justin Seitz
- http://en.wikipedia.org/wiki/Address_space_layout_randomization
- http://msdn.microsoft.com/en-us/library/windows/desktop/ms680657%28v=vs.85%29.aspx
- http://en.wikipedia.org/wiki/Microsoft-specific_exception_handling_mechanisms
- http://www.microsoft.com/msj/0197/exception/exception.aspx
- http://technet.microsoft.com/en-us/security/bulletin/ms12-001?altTemplate=SecurityBulletinPF
- http://support.microsoft.com/kb/956607
- http://www.scribd.com/doc/68670616/Structured-Exception-Handler-Exploitation
- http://www.exploit-db.com/wp-content/themes/exploit/docs/17505.pdf
- http://resources.infosecinstitute.com/in-depth-seh-exploit-writing-tutorial-using-ollydbg/#sehchain
- http://en.wikipedia.org/wiki/Stack_%28data_structure%29
- http://www.csanimated.com/animation.php?t=Stack
- http://en.wikipedia.org/wiki/Processor_register
- http://www.giac.org/paper/gcih/745/exploiting-ability-server-ftp-stor-appe-vulnerability/104560
